Your spend, in a table you can actually work with.
Spend puts your unified Azure and AWS cost into a clean, exportable table — switch between a daily or monthly view, slice it over time, by service, or by account, and hand the numbers straight to finance.
Daily or monthly
One click flips the whole table between per-day and per-month, always respecting the date range you picked.
Slice it three ways
Over time, by service, or by account — each with a total, share of spend, period-over-period change, and running total.
Filter to what matters
Scope by cloud group, filter to Azure or AWS, search, and view everything in your reporting currency.
Export to CSV & PDF
Download the exact view — filters, granularity and all — as a spreadsheet-ready CSV or a branded PDF report.
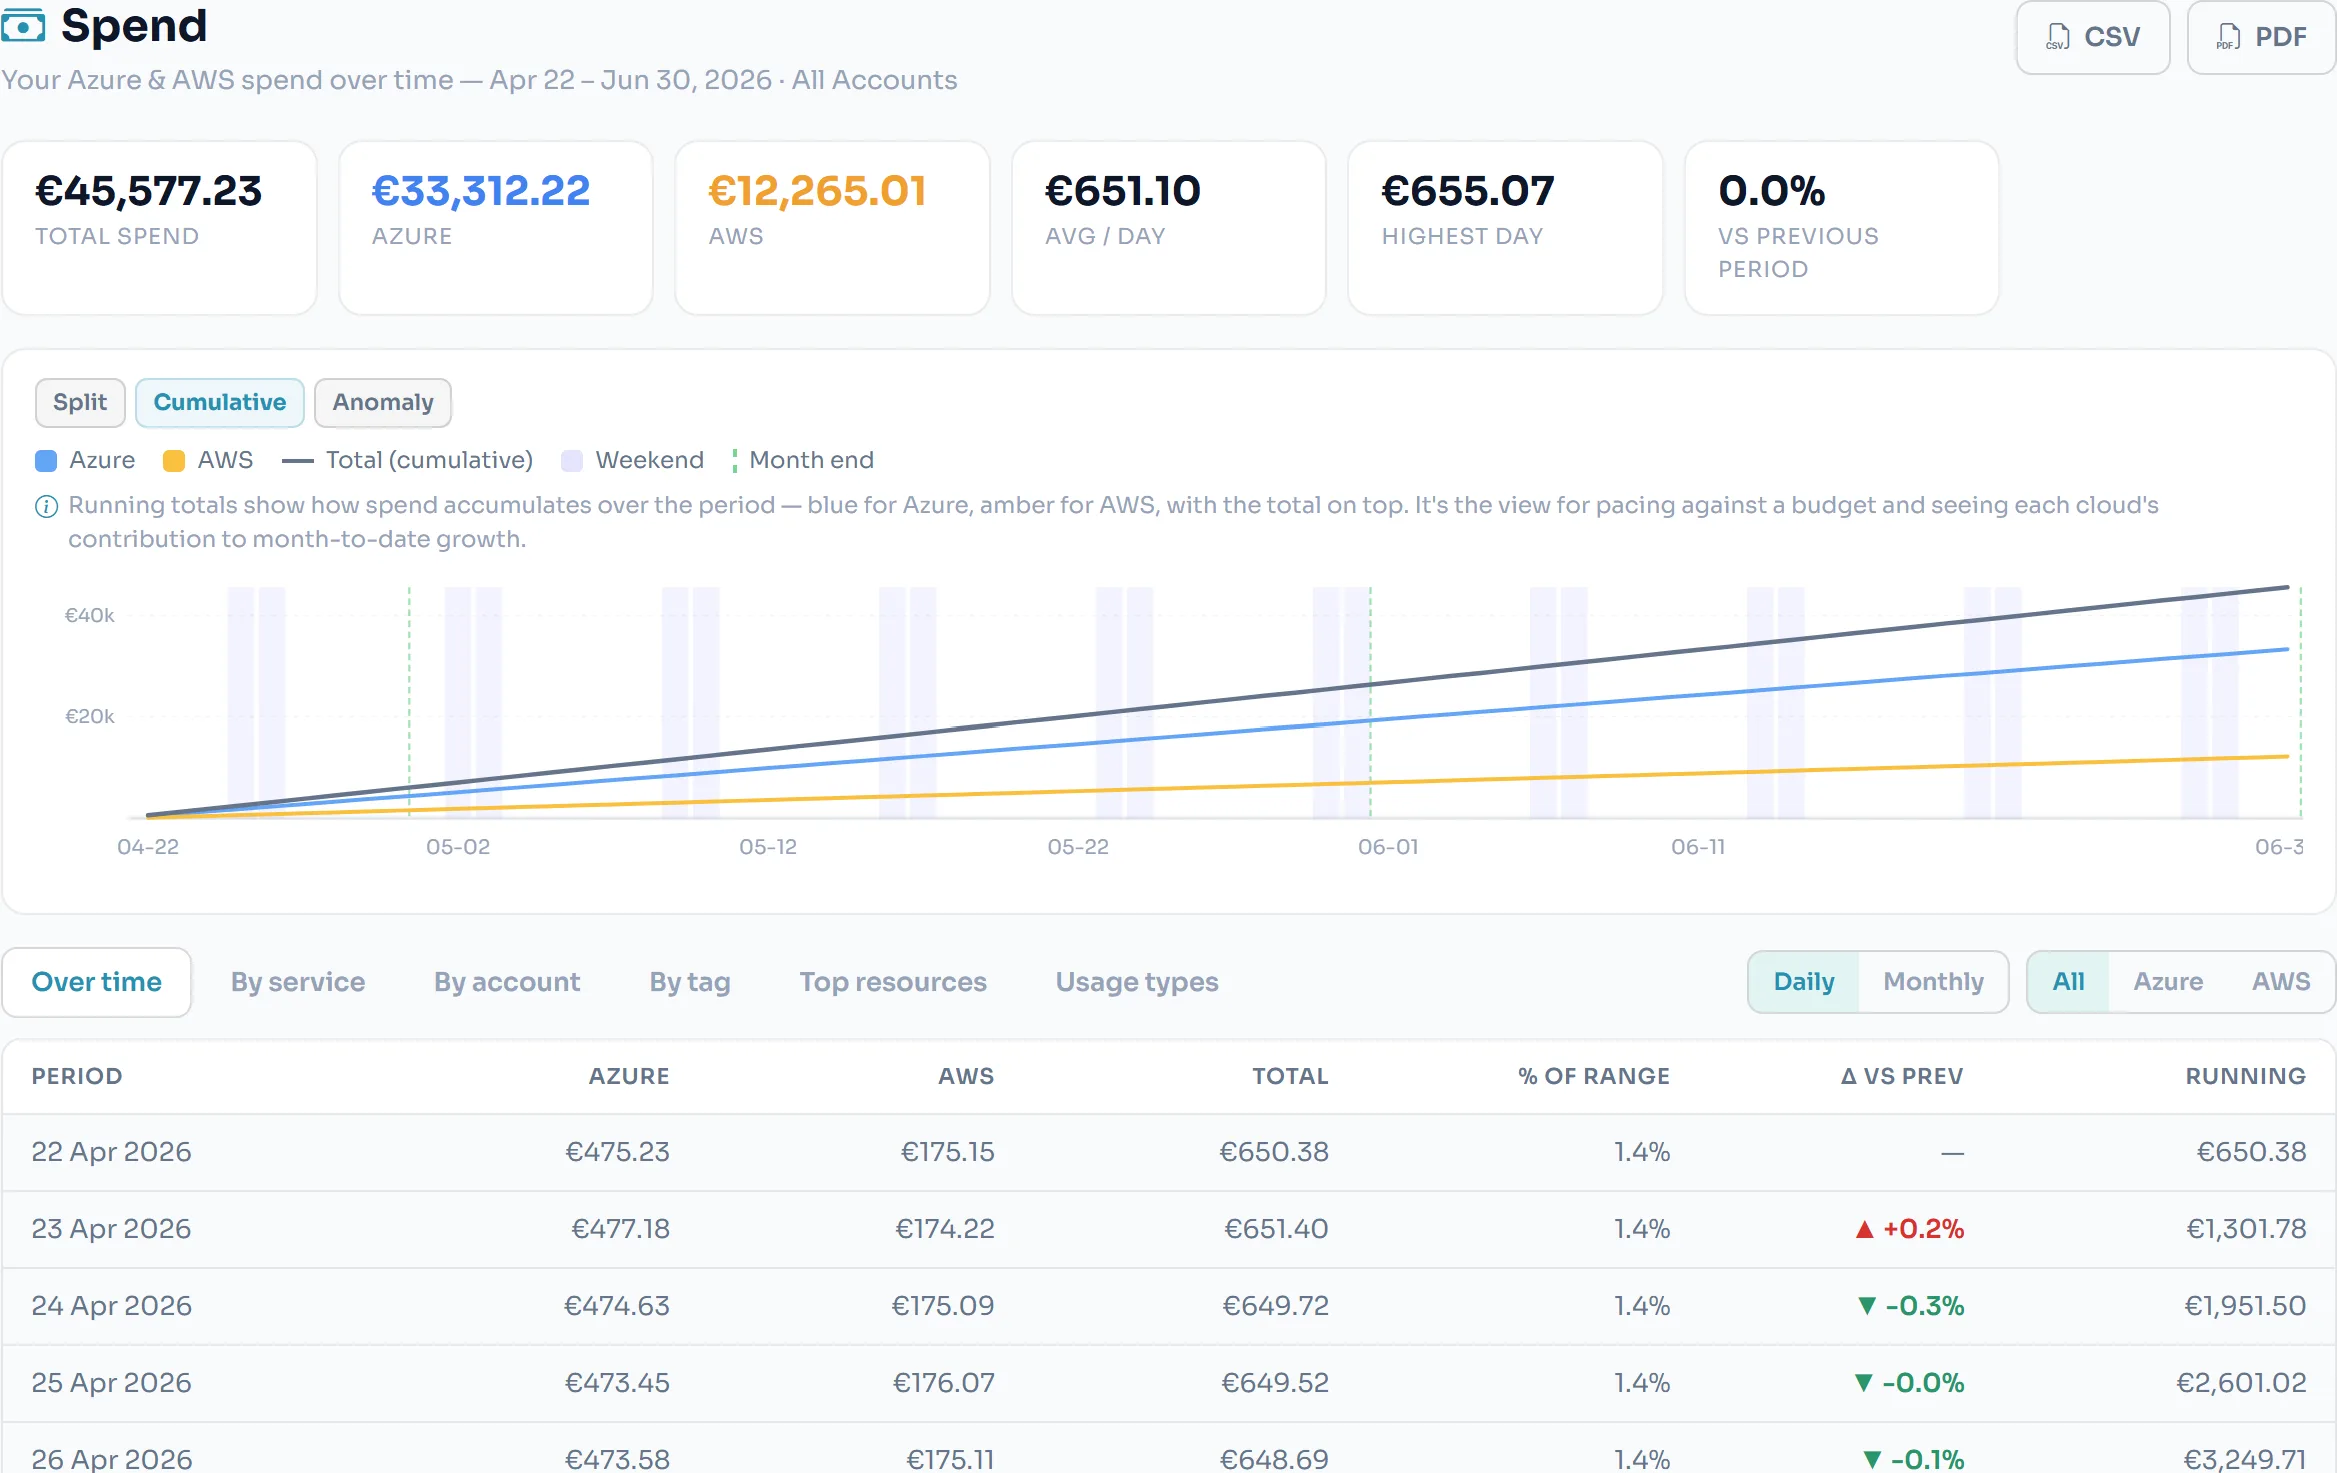
Over time — running totals with a daily or monthly breakdown
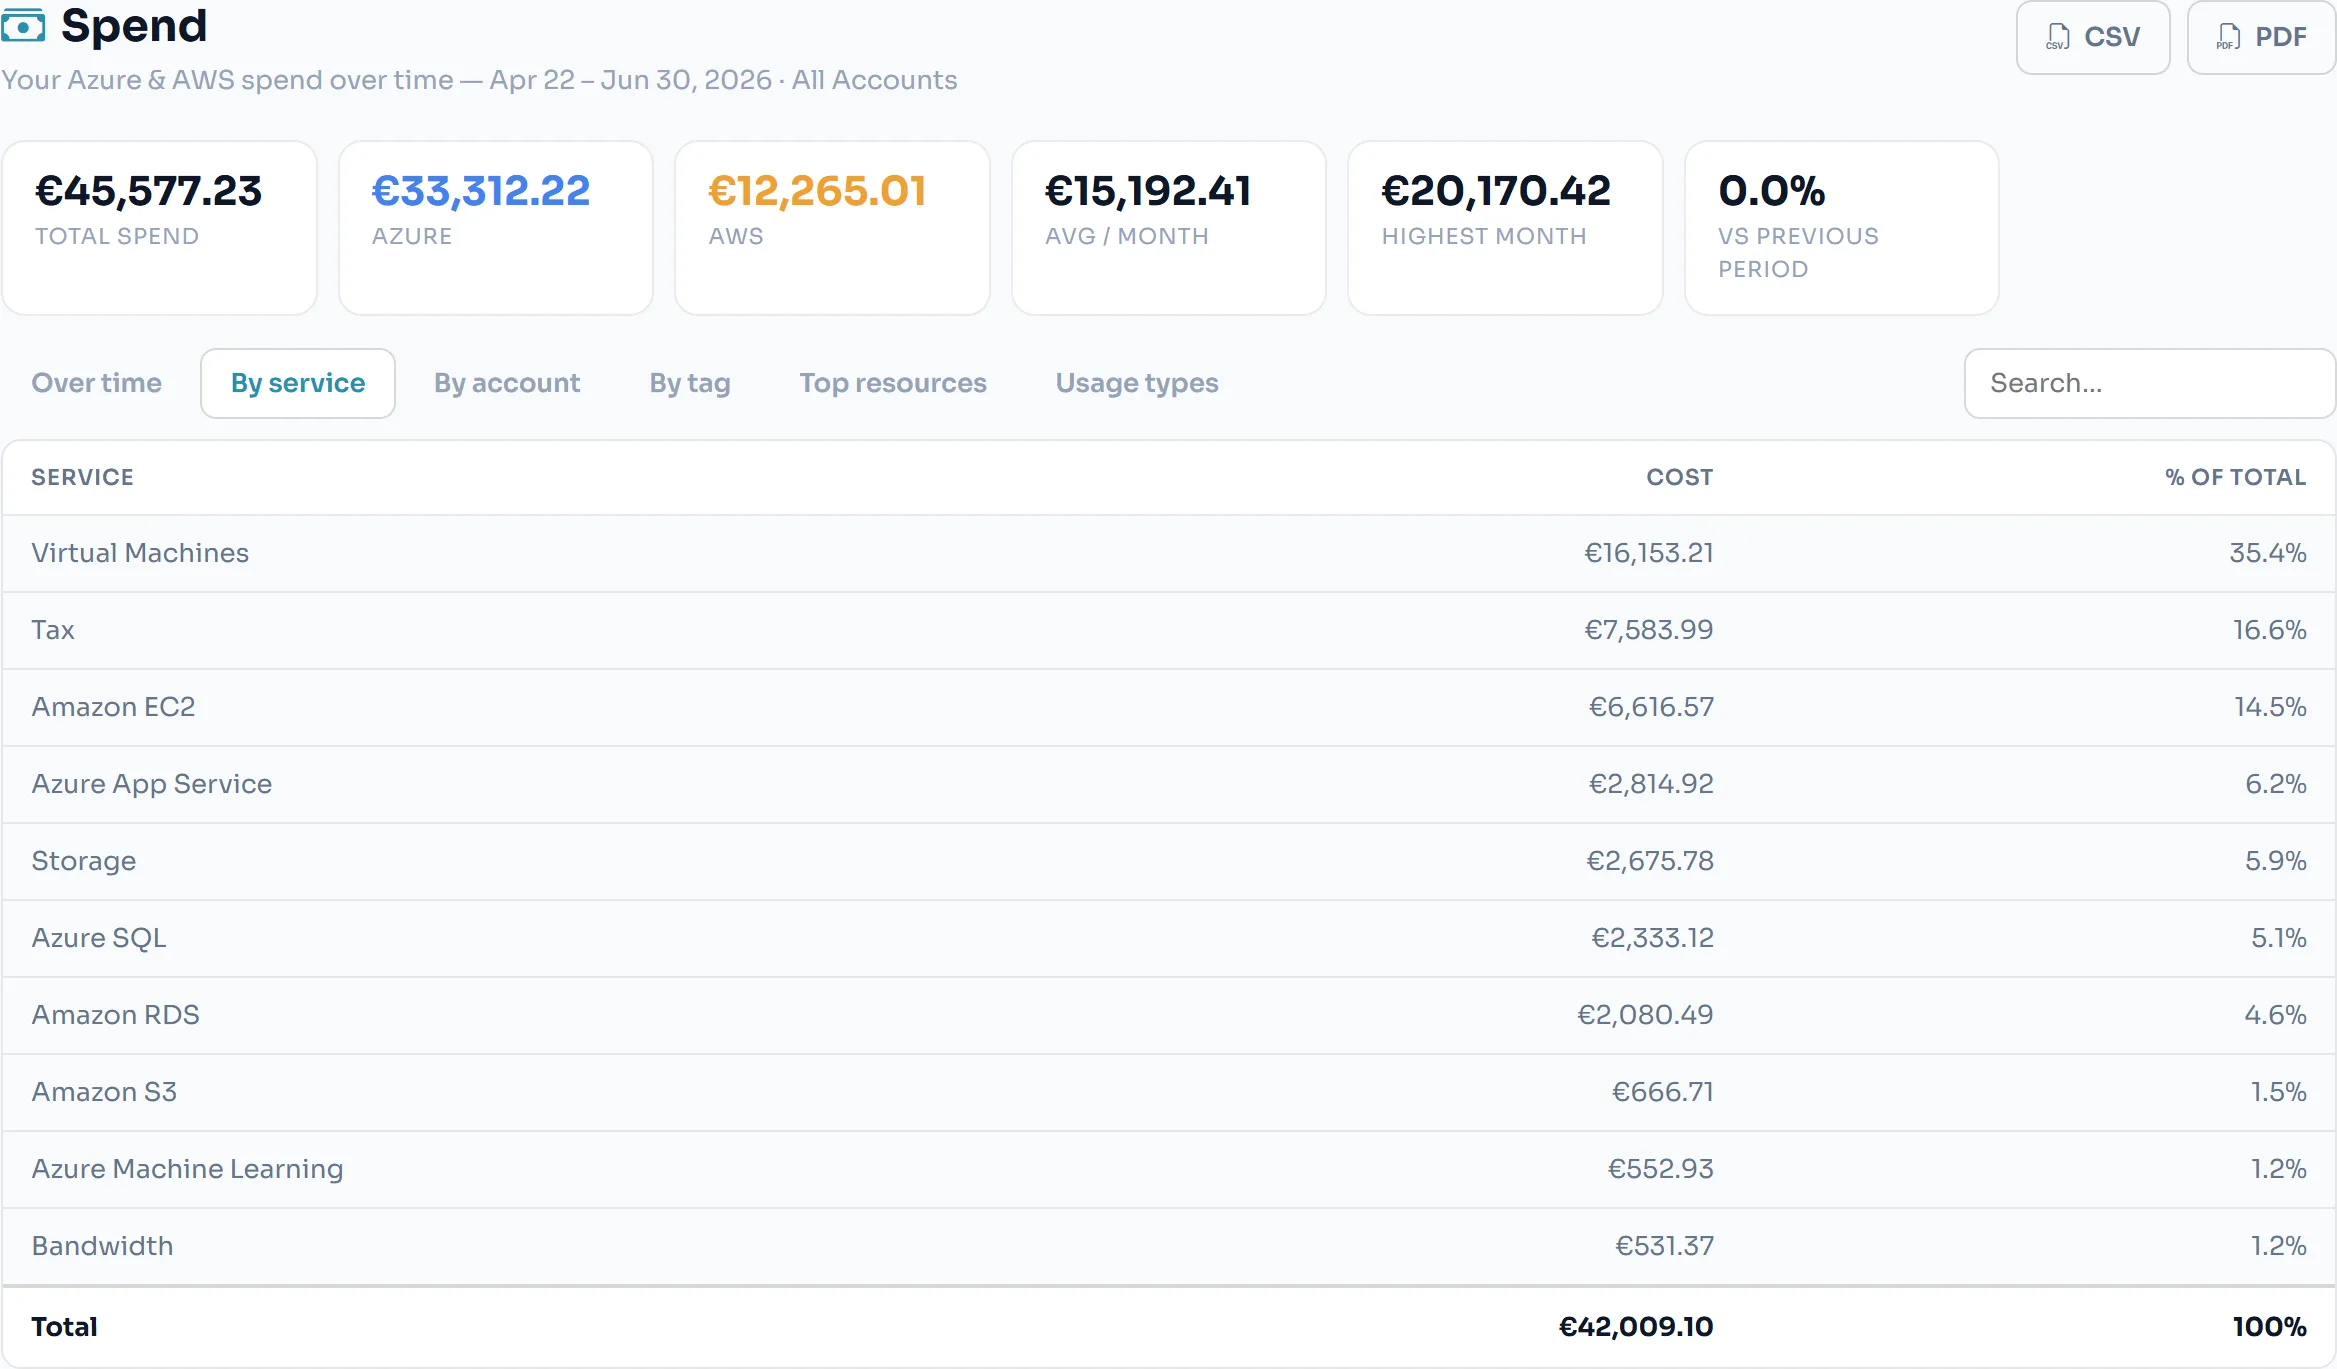
By service — every Azure and AWS service, ranked by cost
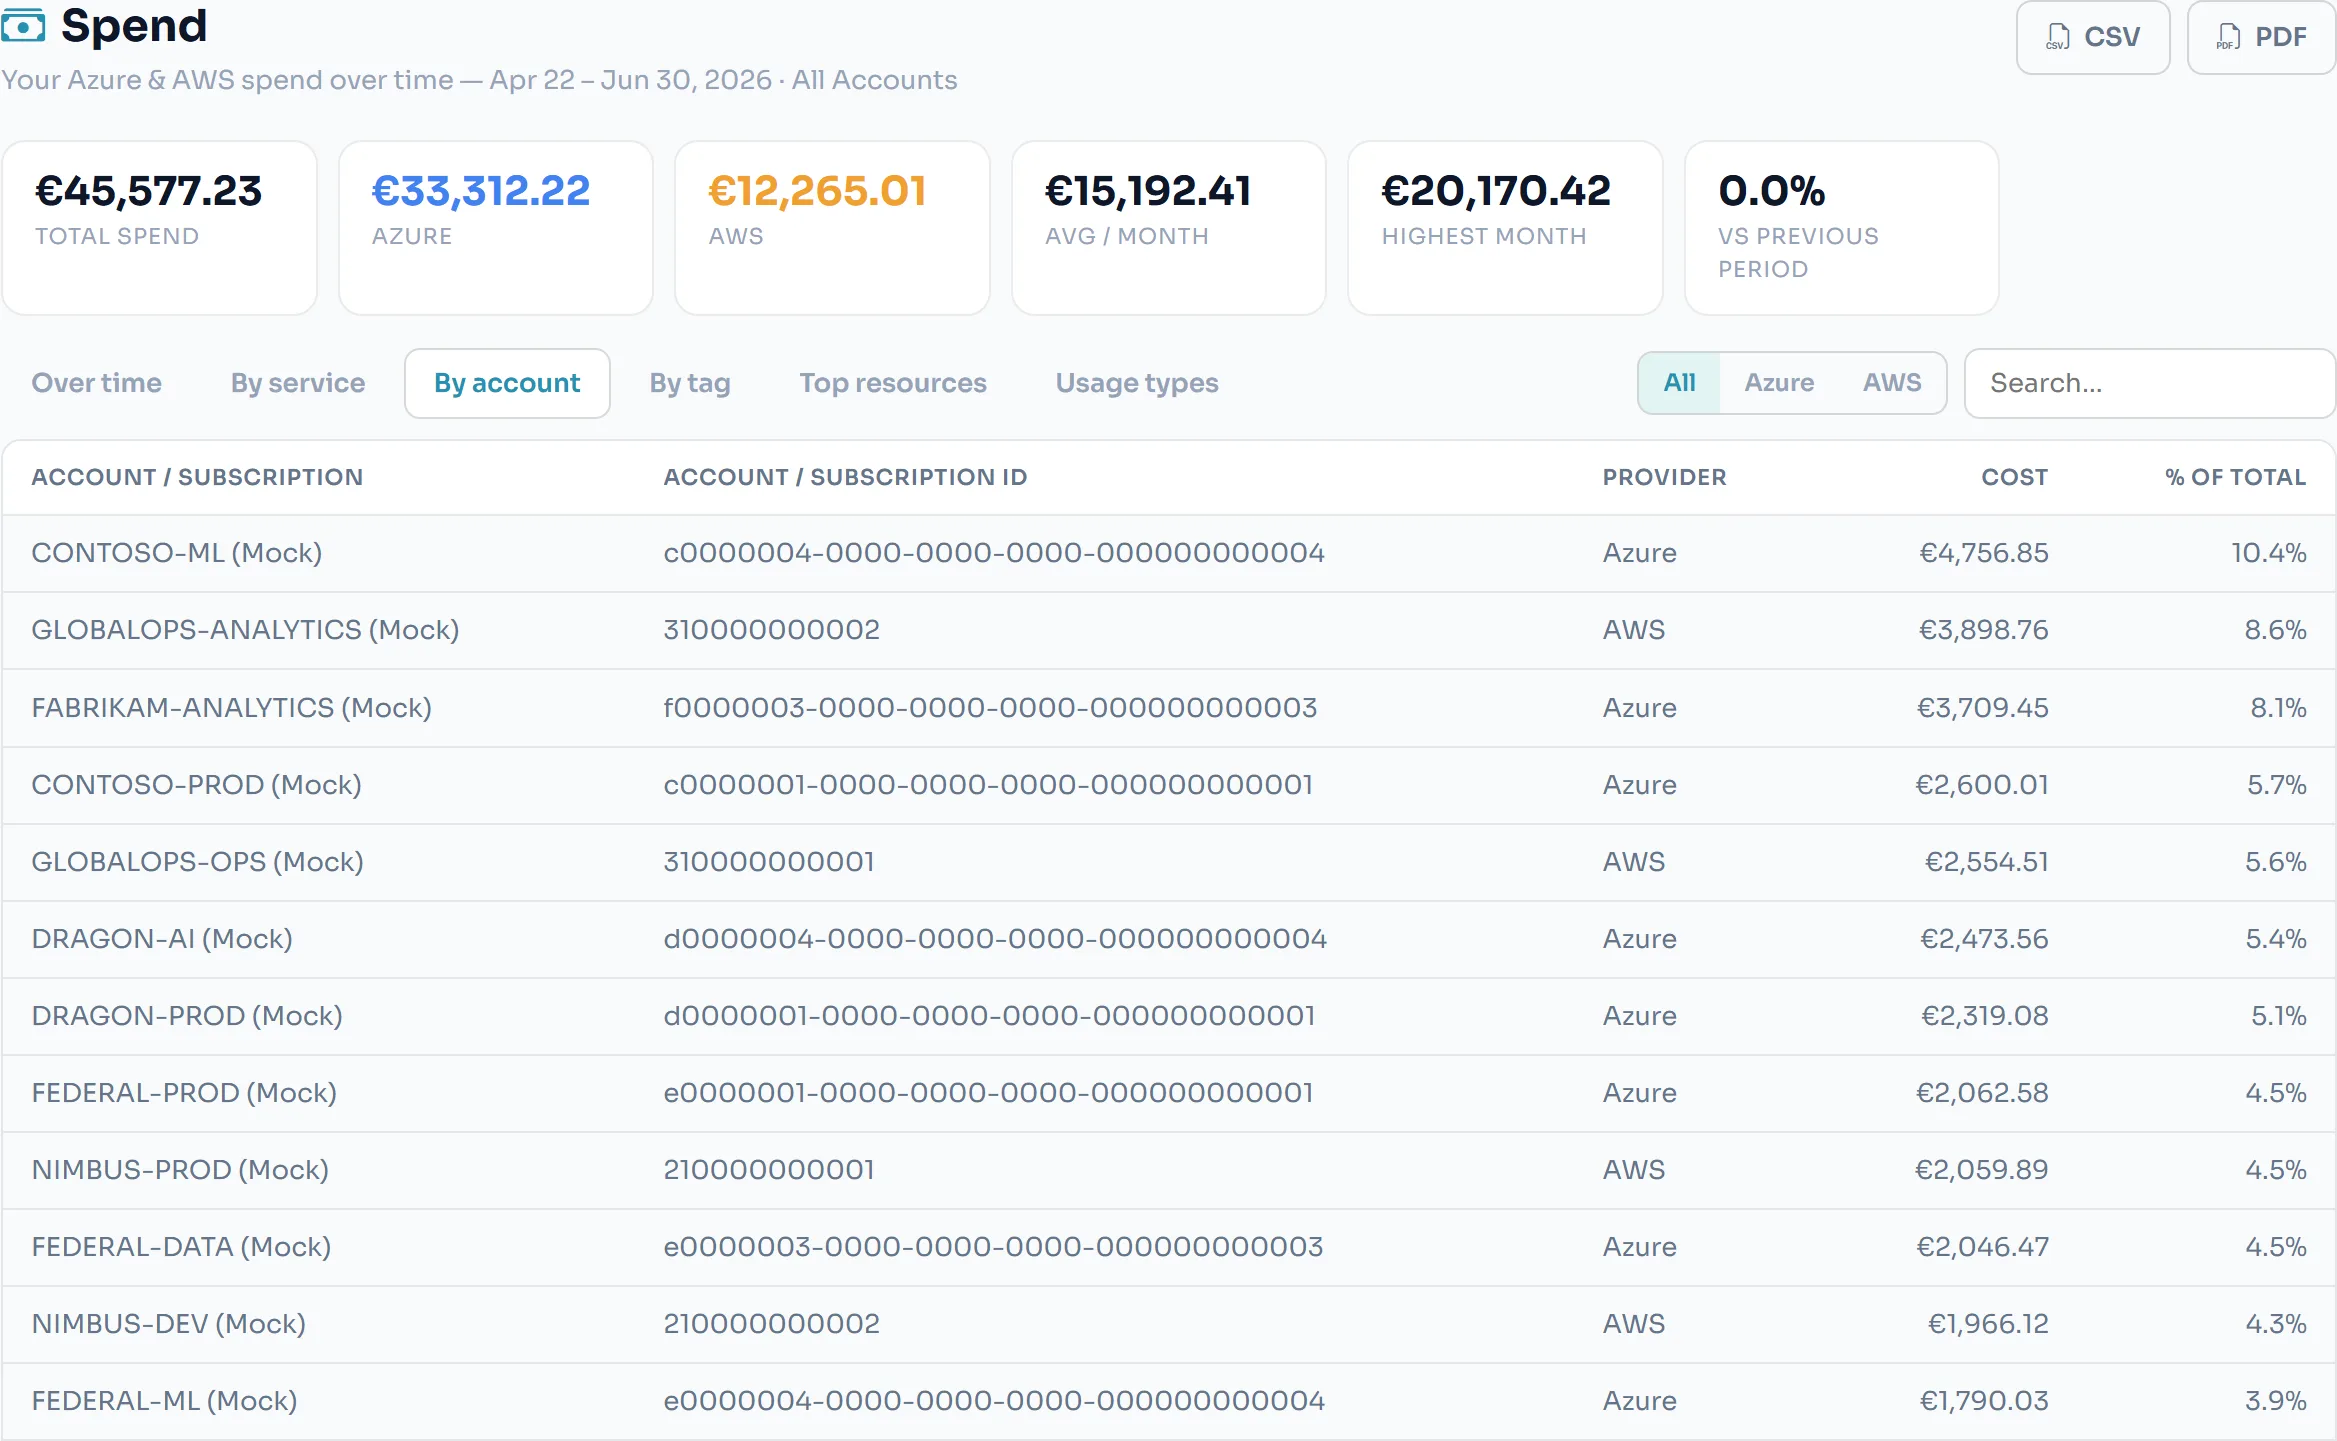
By account — spend per subscription and AWS account